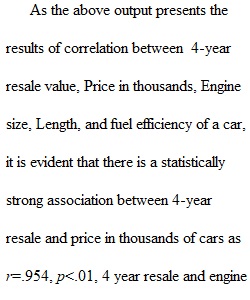
Q For this assignment, you'll be building your familiarity with correlation, simple linear regression, and multiple regression in SPSS. Watch these three videos: 04 Correlation in SPSS – SPSS for Beginners by Research by Design (Dec 6, 2017) https://www.youtube.com/watch?v=6EH5DSaCF_8 (Links to an external site.) SPSS for Beginners 6: Regression by Research by Design (April 21, 2017) https://www.youtube.com/watch?v=JVwEdhEiGJg (Links to an external site.) How to Calculate Multiple Linear Regression with SPSS by Statisticsfun (July 29, 2012) How to Calculate Multiple Linear Regression with SPSS (Links to an external site.) Go to IBM SPSS Statistics on the Highline College Virtual Computer Lab (you may need to click on an "OK" if the system tells you that the license has expired) Create a MS Word .docx file that you can save your work into and submit it on Canvas (it may be useful to connect a OneDrive account on the virtual machine so that it saves your work to the cloud). On the opening splash window, select the option for sample files and open the credit scoring data file “car_sales.sav” Using the assigned "car_sales.sav" data set, complete the following – number your answers as indicated (3 pts each) 1. Create a correlation matrix for the following variables, paste it into your document, and list out the 3 strongest statistically significant correlations between different variables (give the variables and the correlation value) o 4-year resale value o Price in thousands o Engine size o Length o fuel efficiency 2. Create a scatterplot of 4-year resale value on the y-axis and price in thousands on the x-axis. Paste it into your document. How would you describe the relationship shown? 3. Run a regression with Price in thousands as the dependent variable and Length and Fuel efficiency as the independent variables. Give the regression model equation and R-square and explain which estimated coefficients appear to be statistically significant and how you know. How much faith would you have in these regression estimates and why? 4. Run a regression with Price in thousands as the dependent variable and Horsepower, Length and Fuel efficiency as the independent variables. Give the regression model equation and R-square and explain which estimated coefficients appear to be statistically significant. Describe any changes in R-square or estimated coefficients from the regression in #3. 5. Run a regression with 4-year resale value as the dependent variable and Horsepower, Length and Fuel efficiency as the independent variables. Give the regression model equation and R-square. Explain whether horsepower appears to have a bigger impact on the price of new cars or used cars and how you know. Refer to the regression results. Instructions for Accessing IBM SPSS Statistics 1. Access https://horizon.highline.edu Select HTML access, or download the Horizon client app 2. Logon with your Highline username (like for Canvas) 3. Select Win10_Lab 4. It will log you on to a Windows 10 desktop - Once logged on, browse the AppsAnywhere menu for IBM, SPSS will be in that menu (or in search bar type SPSS) 5. Select the option for IBM SPSS Statistics 25
View Related Questions